This past weekend, some of the active San Bernardino Microwave Society (SBMS) gathered at Fairview Park in the early morning to perform a field test of their microwave systems. Since I did not do anything with my rigs this past year, I decided to skip this field test, and take some pictures of any new more interesting rigs for this contest season.
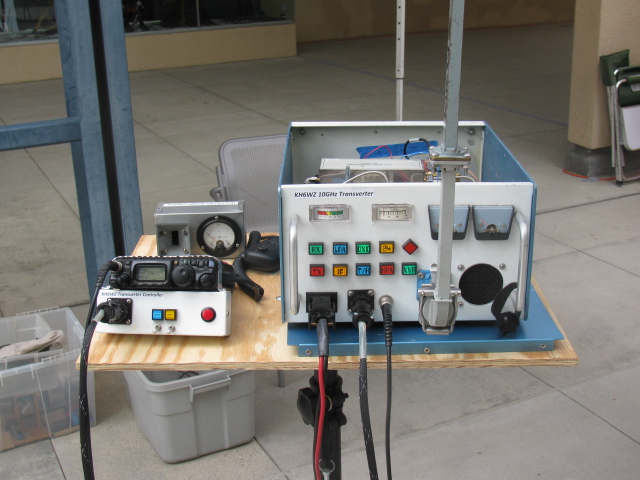
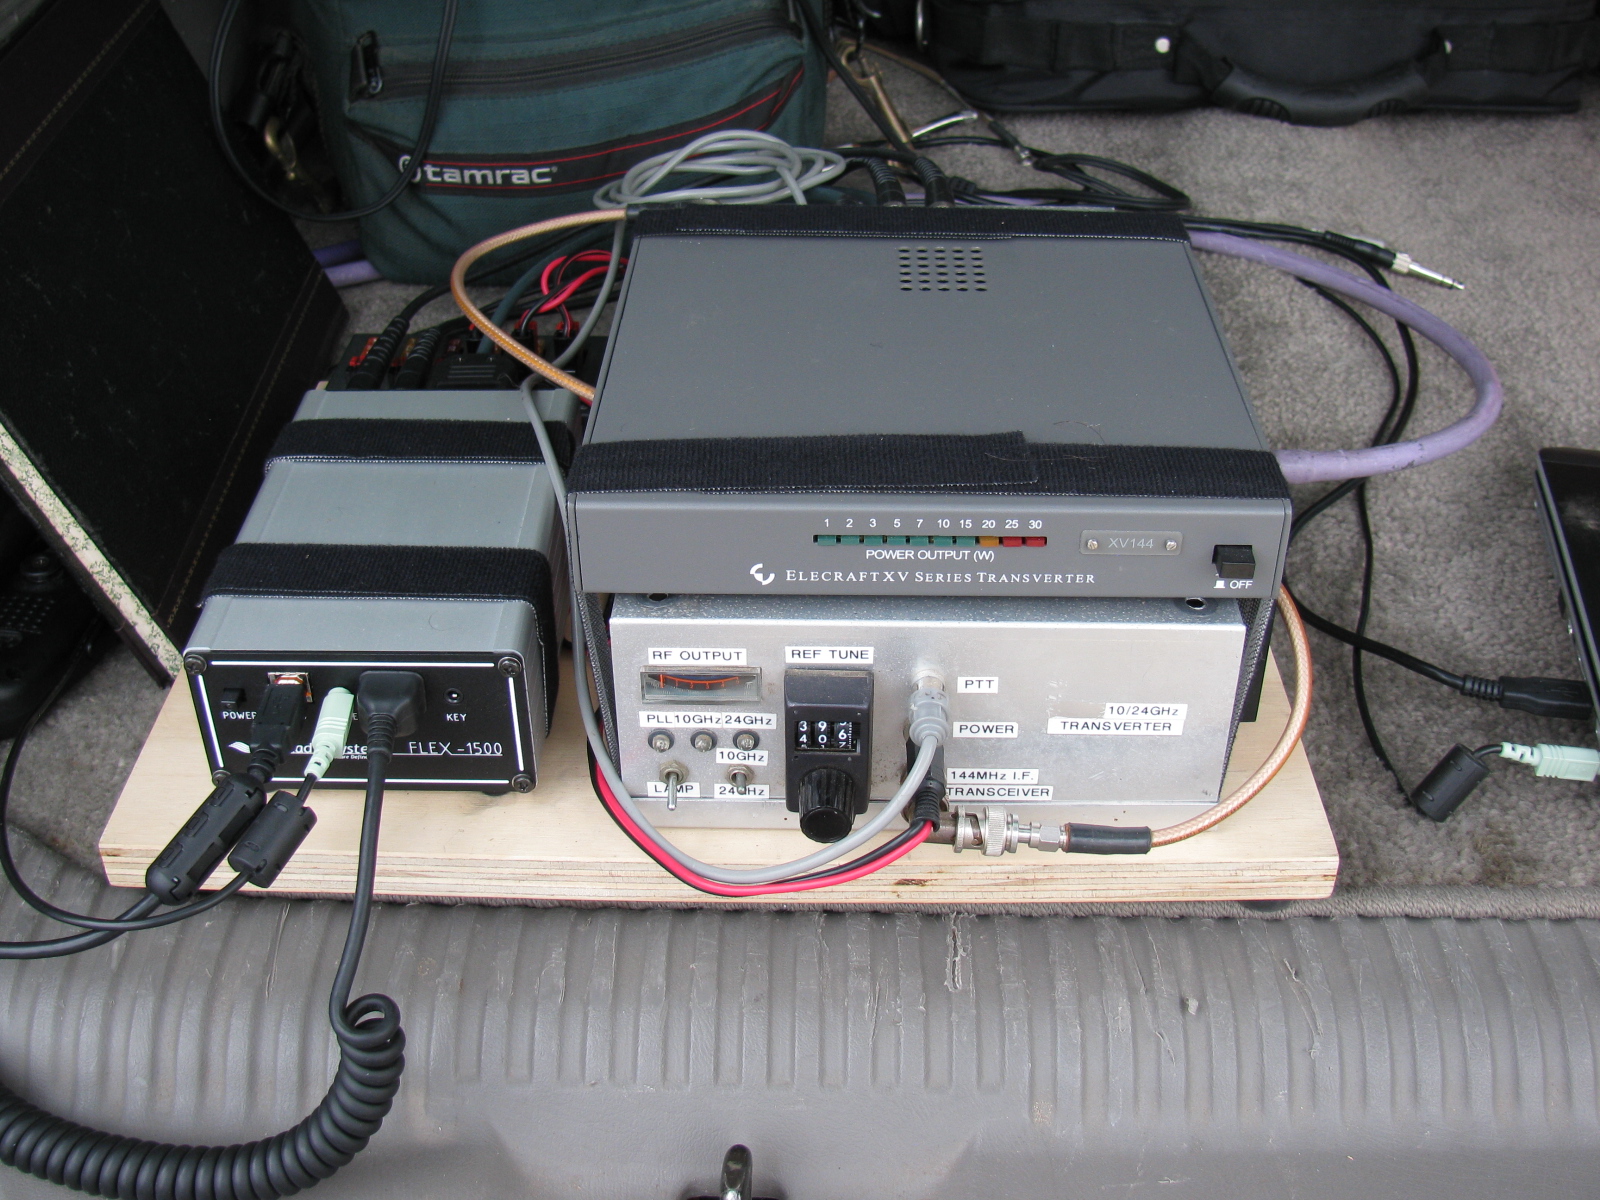
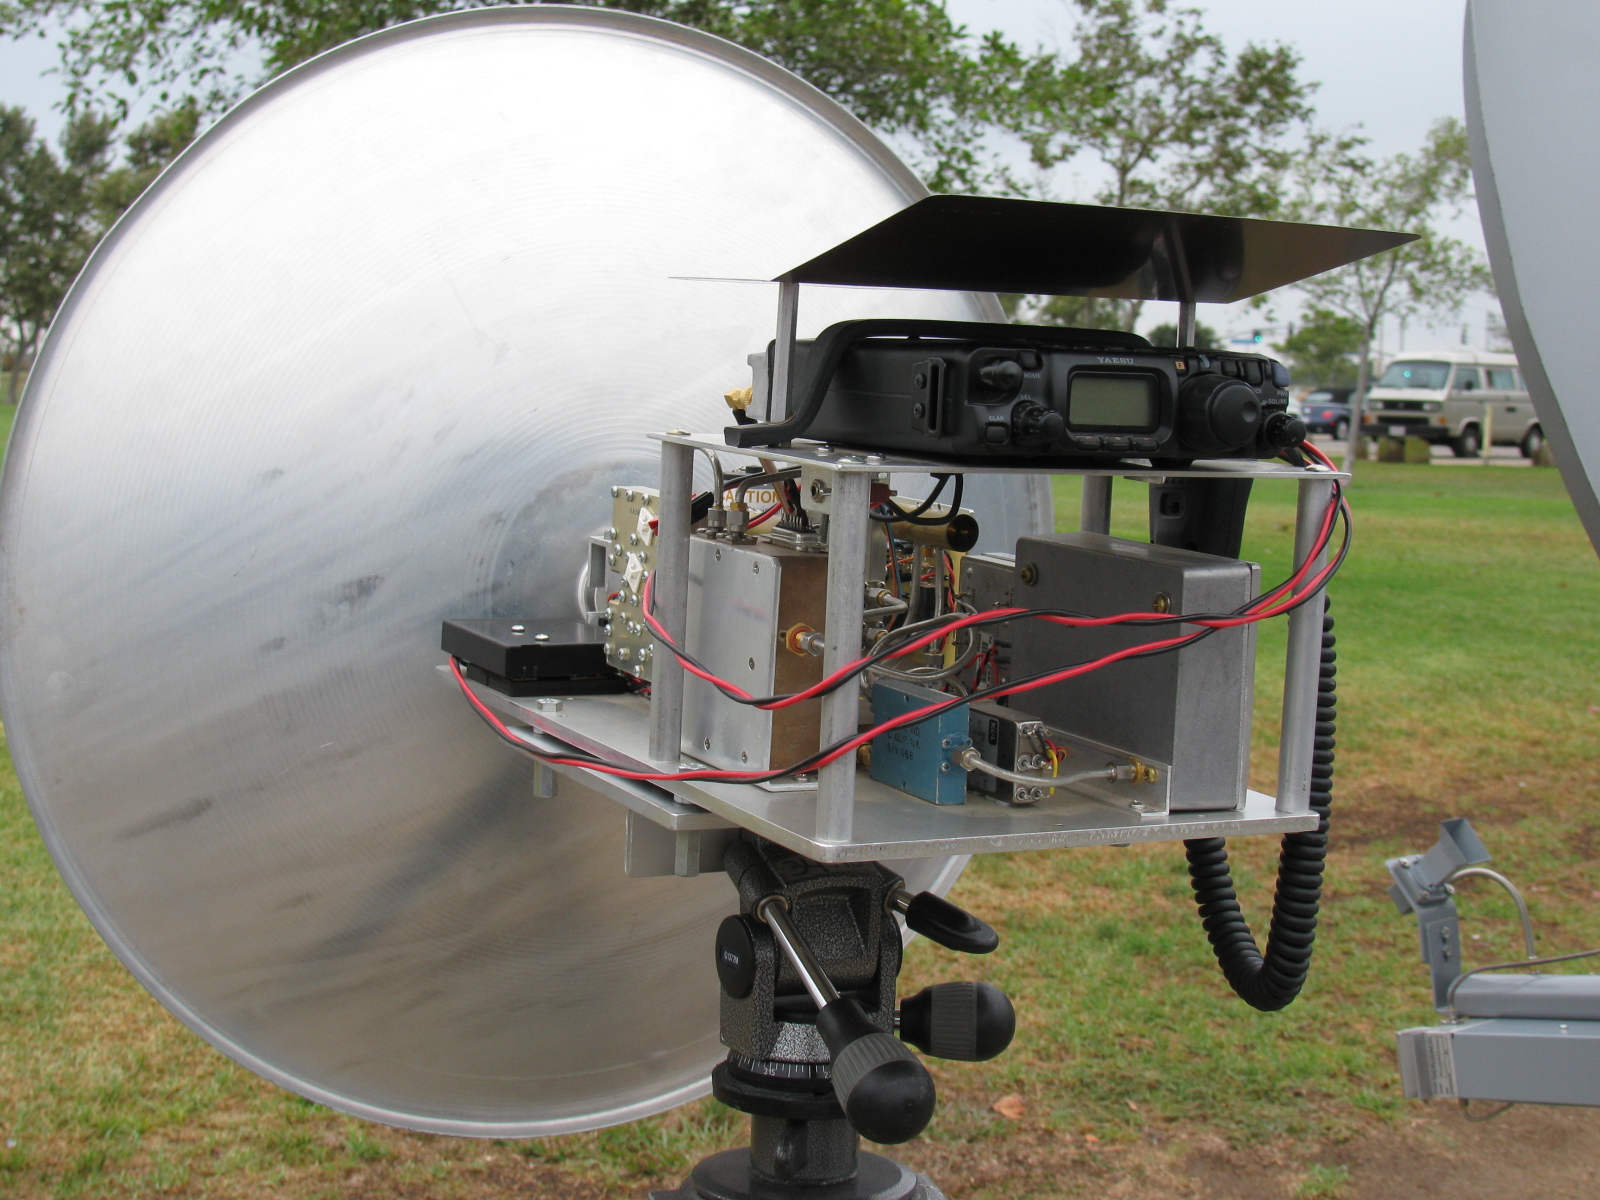
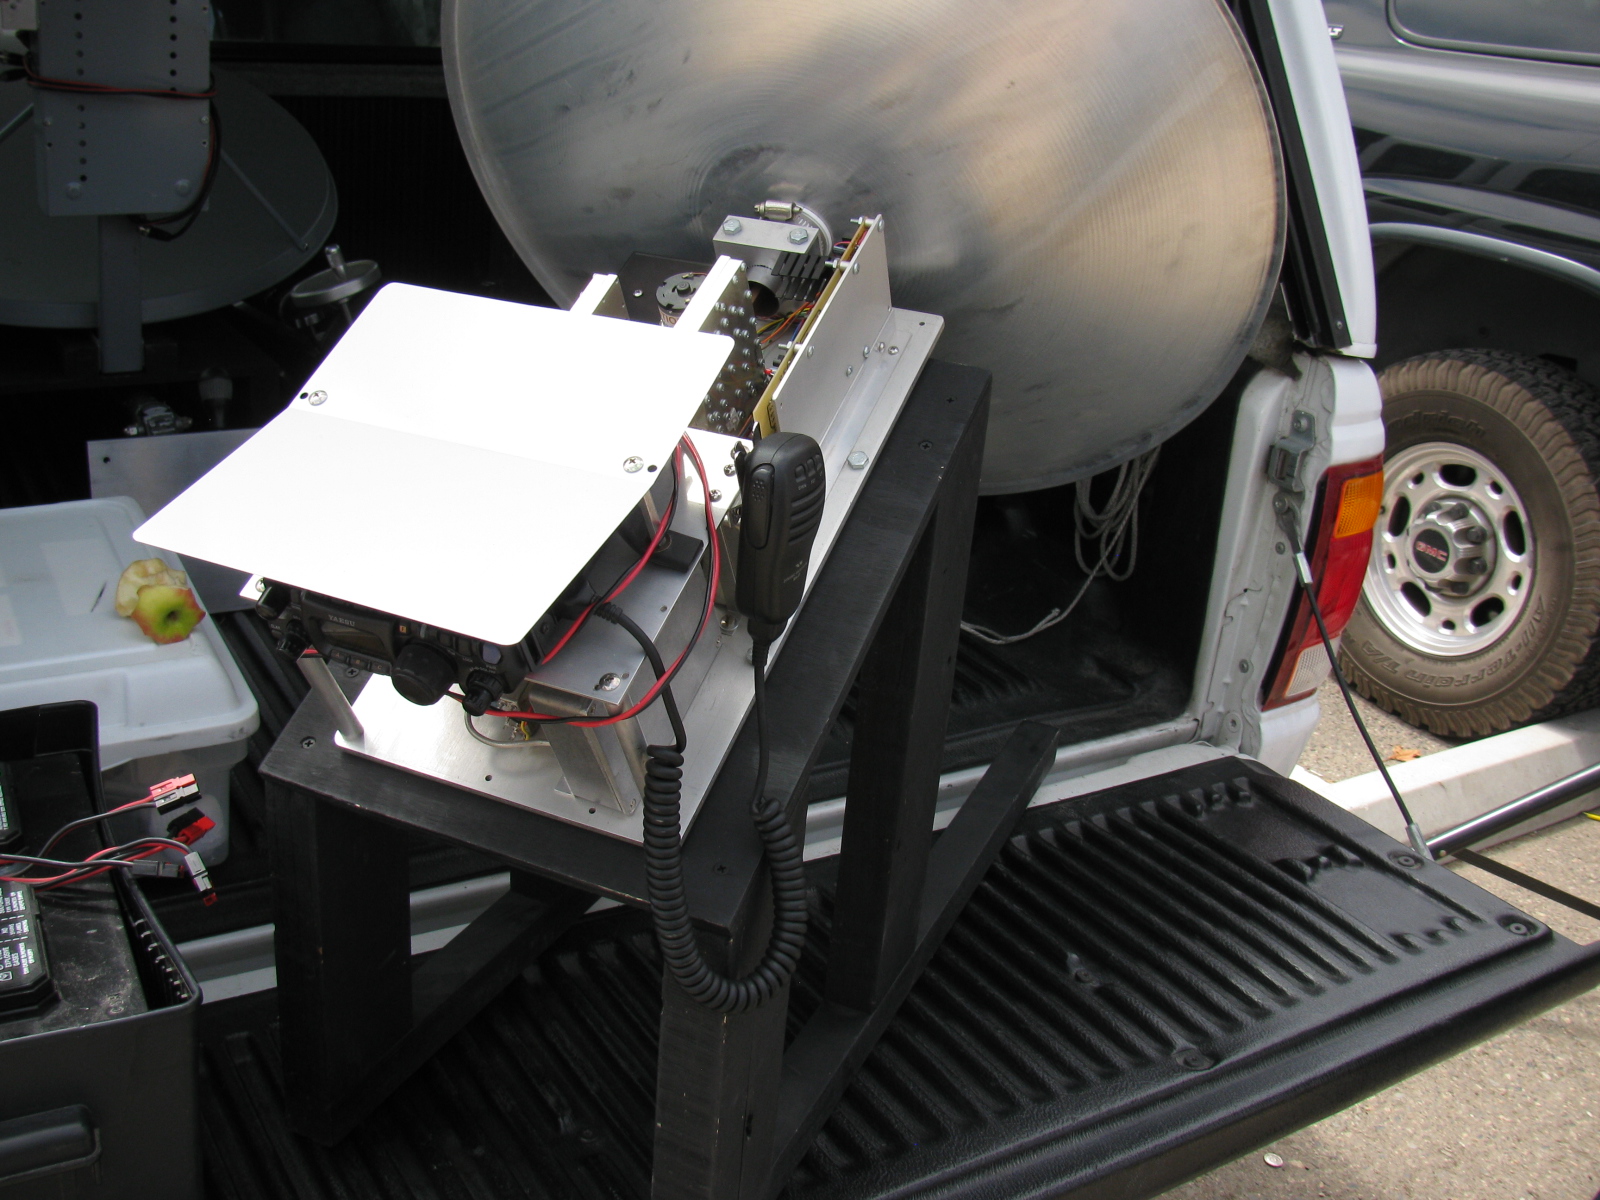
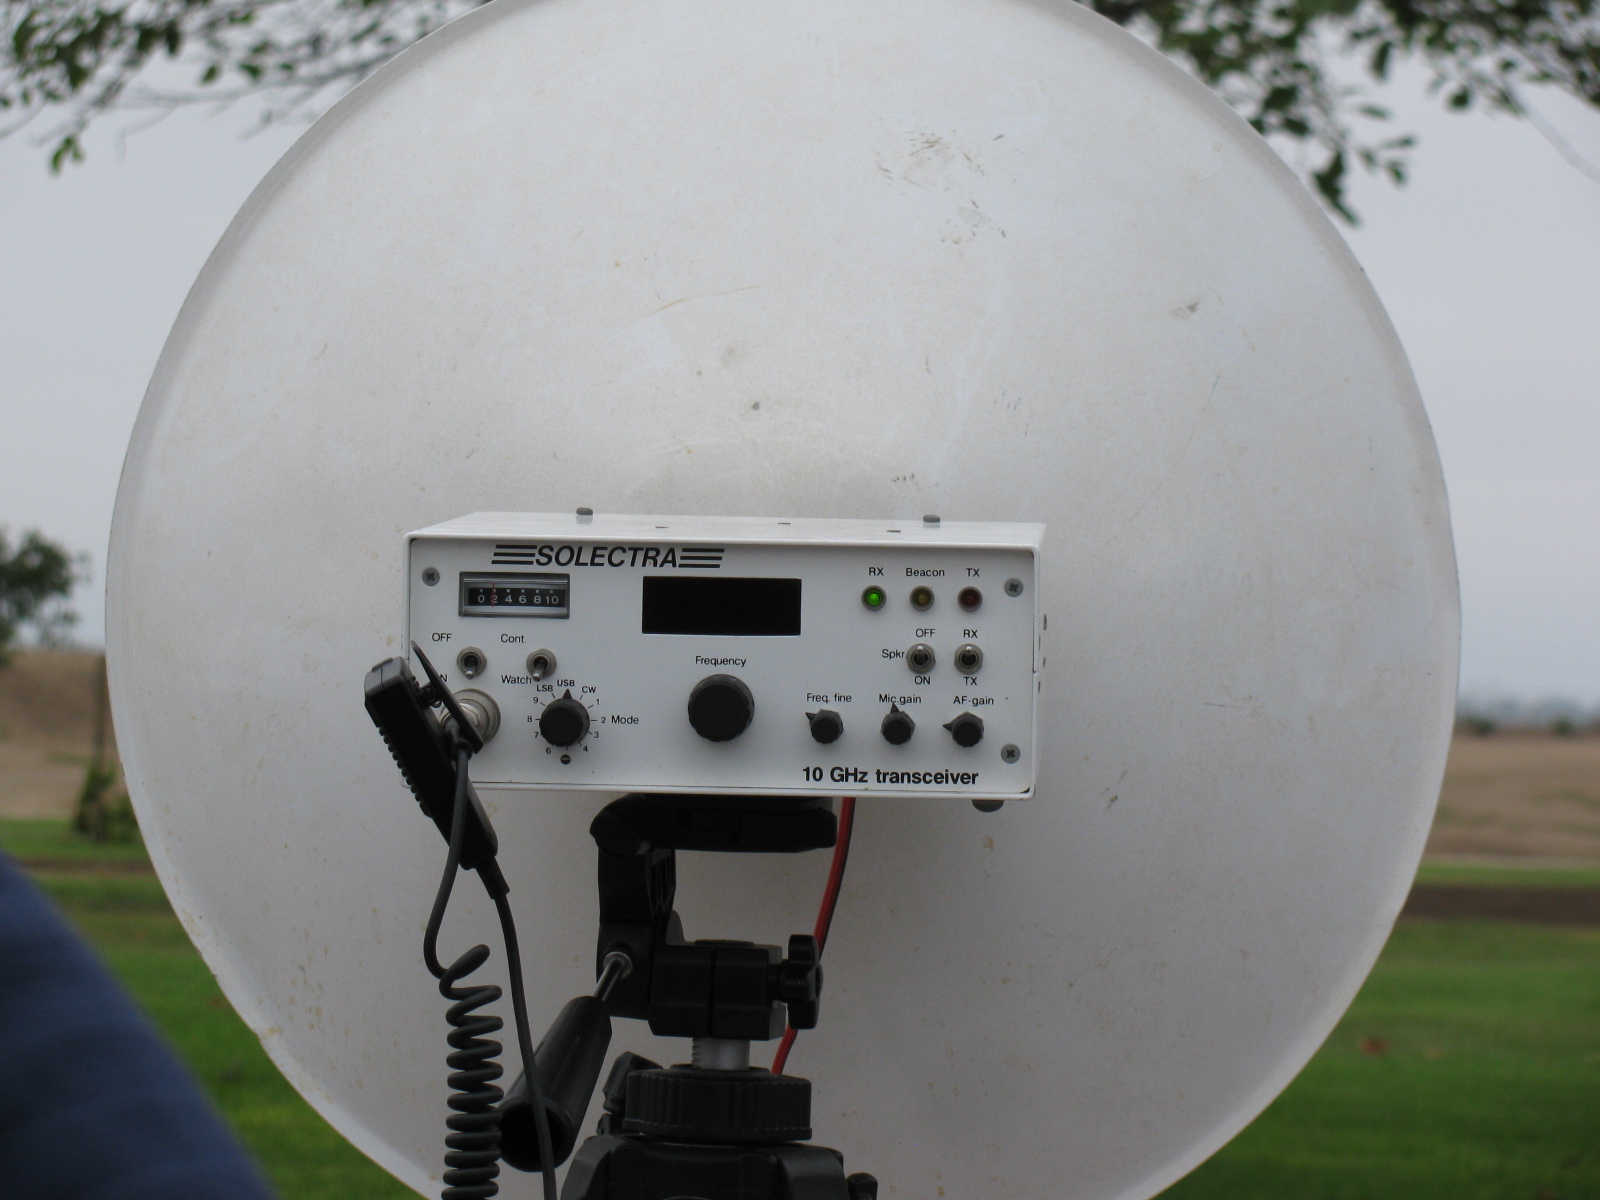
Here are some pictures of the various station equipment SBMS club members built and tested that day . . .


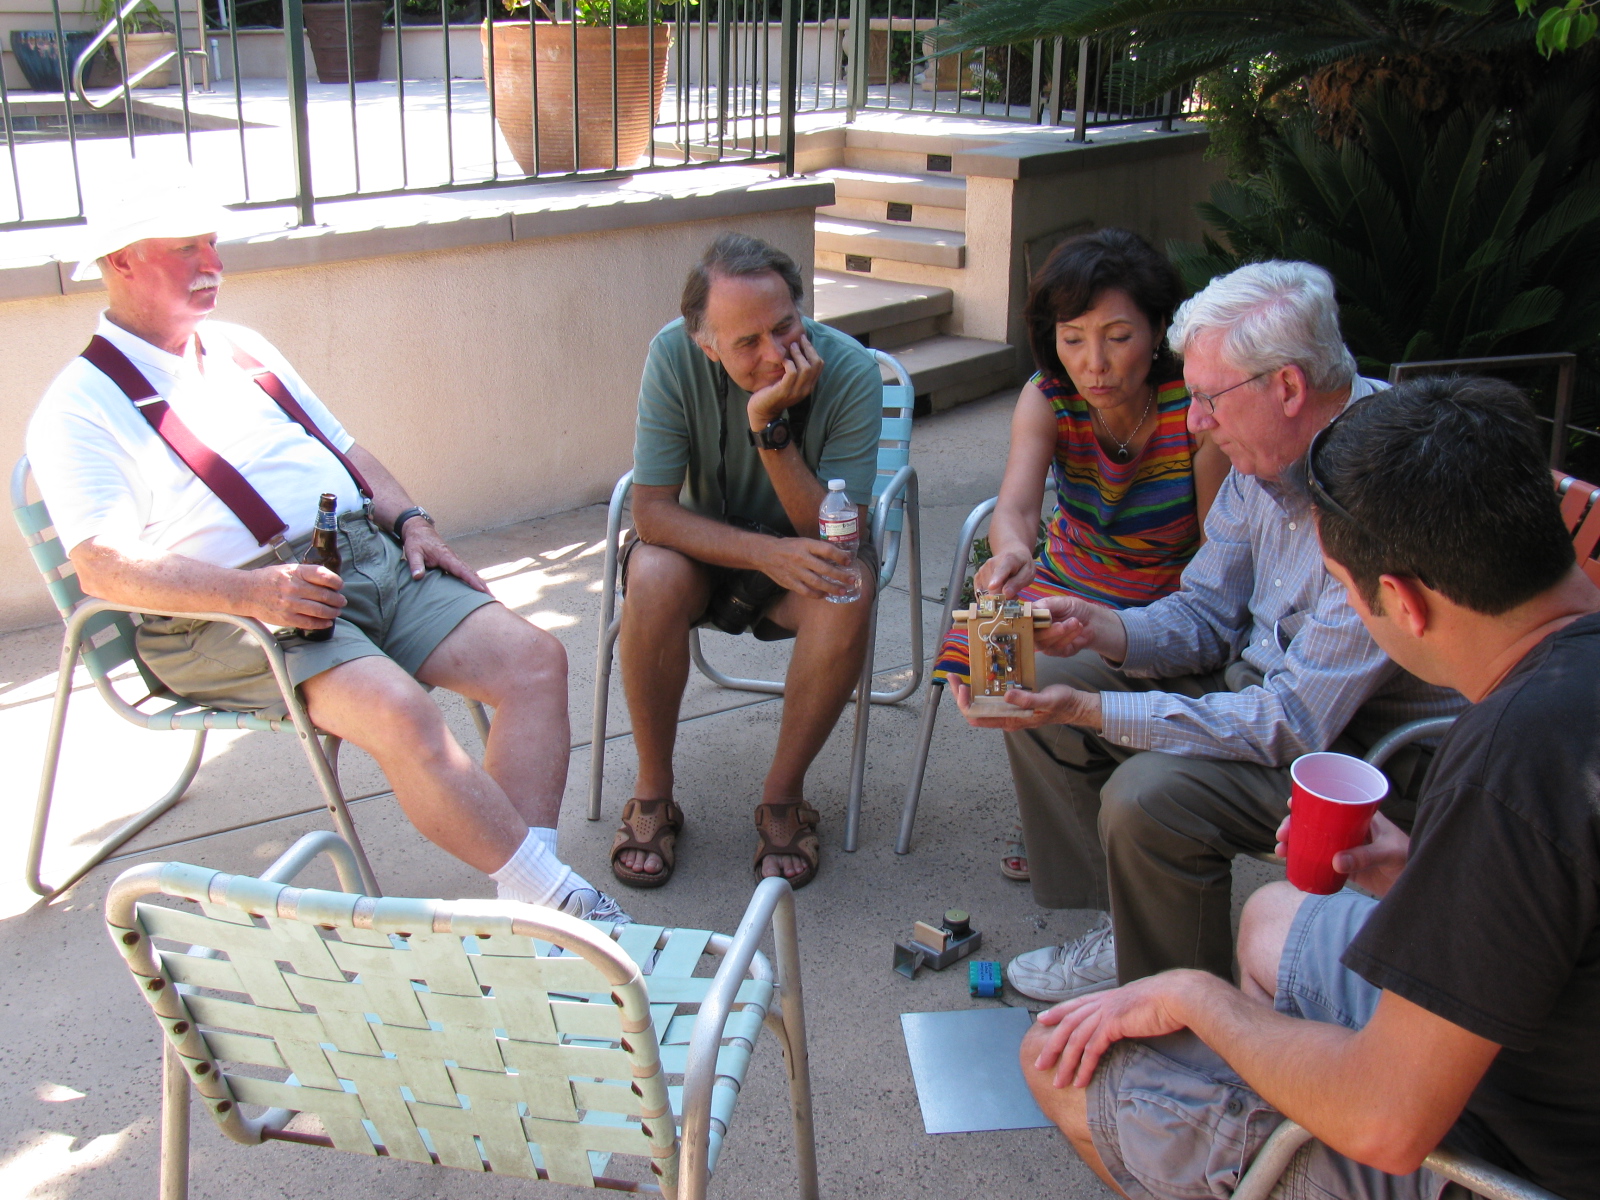
A post-Tune Up Party party and BBQ was held at Dennis W6DQ’s house. It was nice to relax and visit with the other SBMS members and enjoy some great BBQ chicken….. In the picture below, Walt, WALT explains one of his radio wave demonstrations to a captive audience… Watching and learning, from left to right are Bill Preston, KZ3G; Dan Slater, AG6HF and wife Sandy Slater; Walt, and Jason Sogolow, W6IEE.
If you are curious about the test setup, here is an article written by Kerry Banke, N6IZW, with some small edits by me:
Checking Microwave Radio Performance with a Simple ERP/MDS Test Unit
By Kerry Banke, N6IZW (Edited by Wayne Yoshida, KH6WZ)
Before heading for the hills with 10 GHz equipment around contest time, members of the San Diego Microwave Group (SDMG) and the San Bernardino Microwave Society (SBMS) check the Effective Radiated Power (ERP, transmit) and Minimum Discernible Signal (MDS, receive) with the simple setup described in this article. We hold the test sessions at the June and July meetings in preparation for the ARRL 10 GHz and Up Contest in August and September. The advantage to having two sessions is that it provides a second opportunity to verify improvements or allow participation if the first session is missed. The test unit works with both wide band and narrow-band radios.
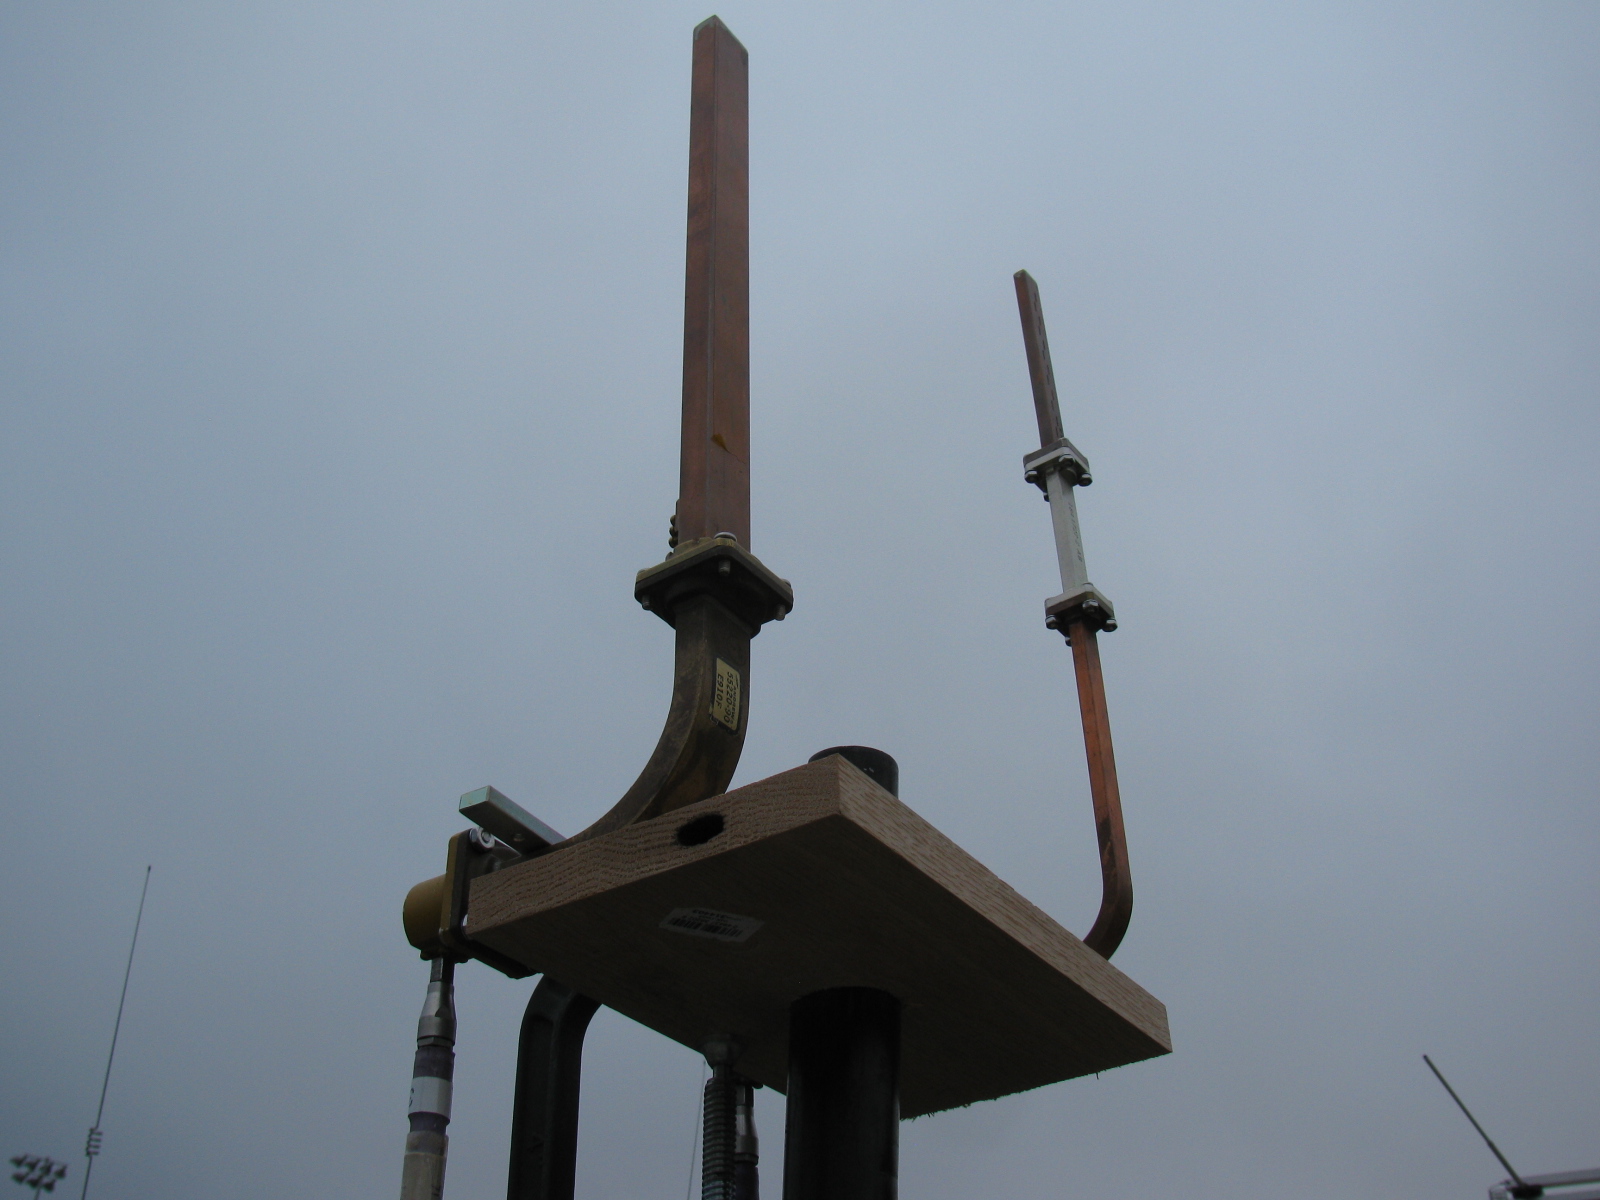
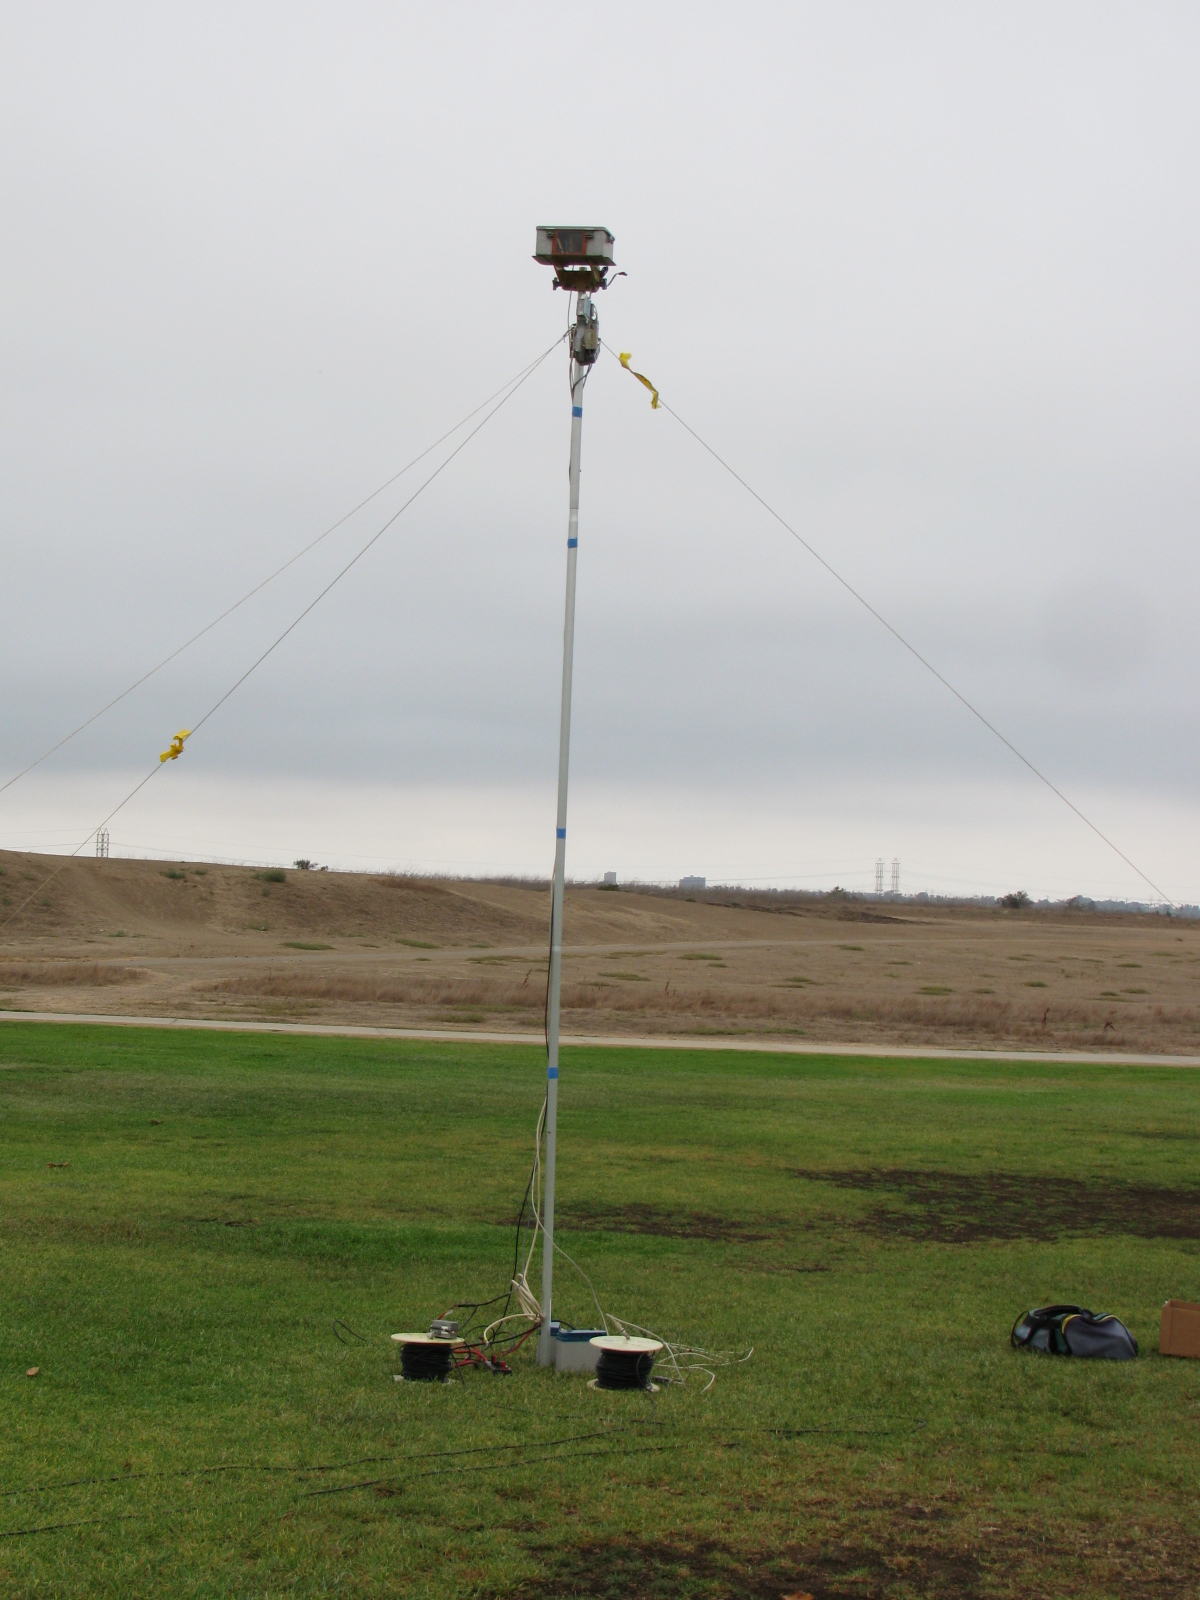
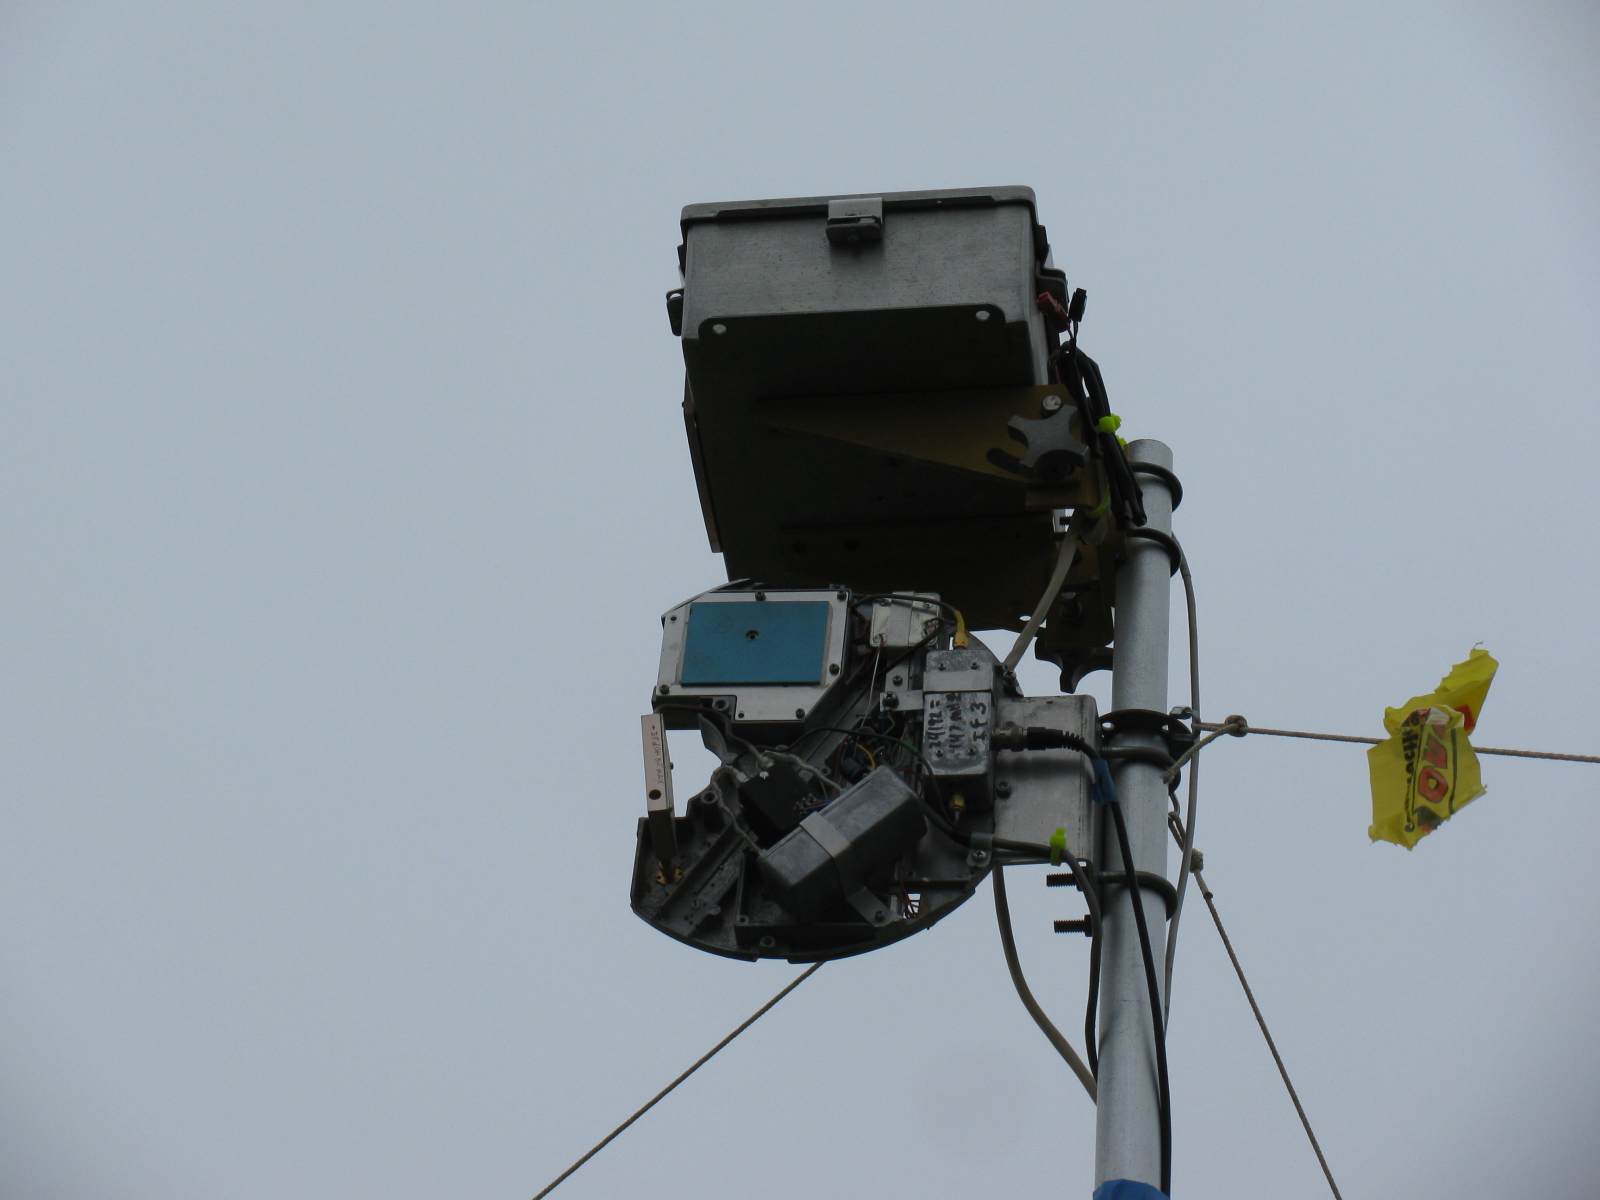
The Pole-Mounted Test Setup
The setup consists of a pole mounted X-Band converter unit connected by coax to a signal source (for MDS) and an amplifier/power meter located near the radios to be tested some 200-300 feet away. The MDS test must be performed first to align the radio antennas with that of the converter. A signal generator is connected to the IF coax and a suitable frequency (145 MHz) and power level (-40 dBm set to transmit an easily detectable carrier around 10368 MHz at the output of the converter.
MDS for Receive
Each participant adjusts their equipment and the system antenna for maximum signal as the power level of the signal generator is reduced to the point where it is no longer detectable by the radios. The level at which the signal can just be detected is considered the MDS.
ERP for Transmit
The ERP measurement is performed by connecting the IF coax to the amplifier and power meter. Each radio transmits one at a time and the power meter reading recorded. The variable attenuator is adjusted to keep the reading in a suitable power range for the power meter and amplifier. For the amplifier used, the maximum output power was about +10 dBm and the power meter range is about –20 to + 10 dBm so the attenuator was adjusted to keep the reading in the –20 to 0 dBm range.
The choice of the IF frequency for the converter depends on what is available for a 10 GHz local oscillator but needs to be low enough to keep the losses reasonable through hundreds of feet of coax. The amplifier gain and maximum output need to be based on the power meter characteristics. The signal generator needs to match the IF frequency chosen, have suitable stability for CW work (NB only), and have variable output (may be an external attenuator).
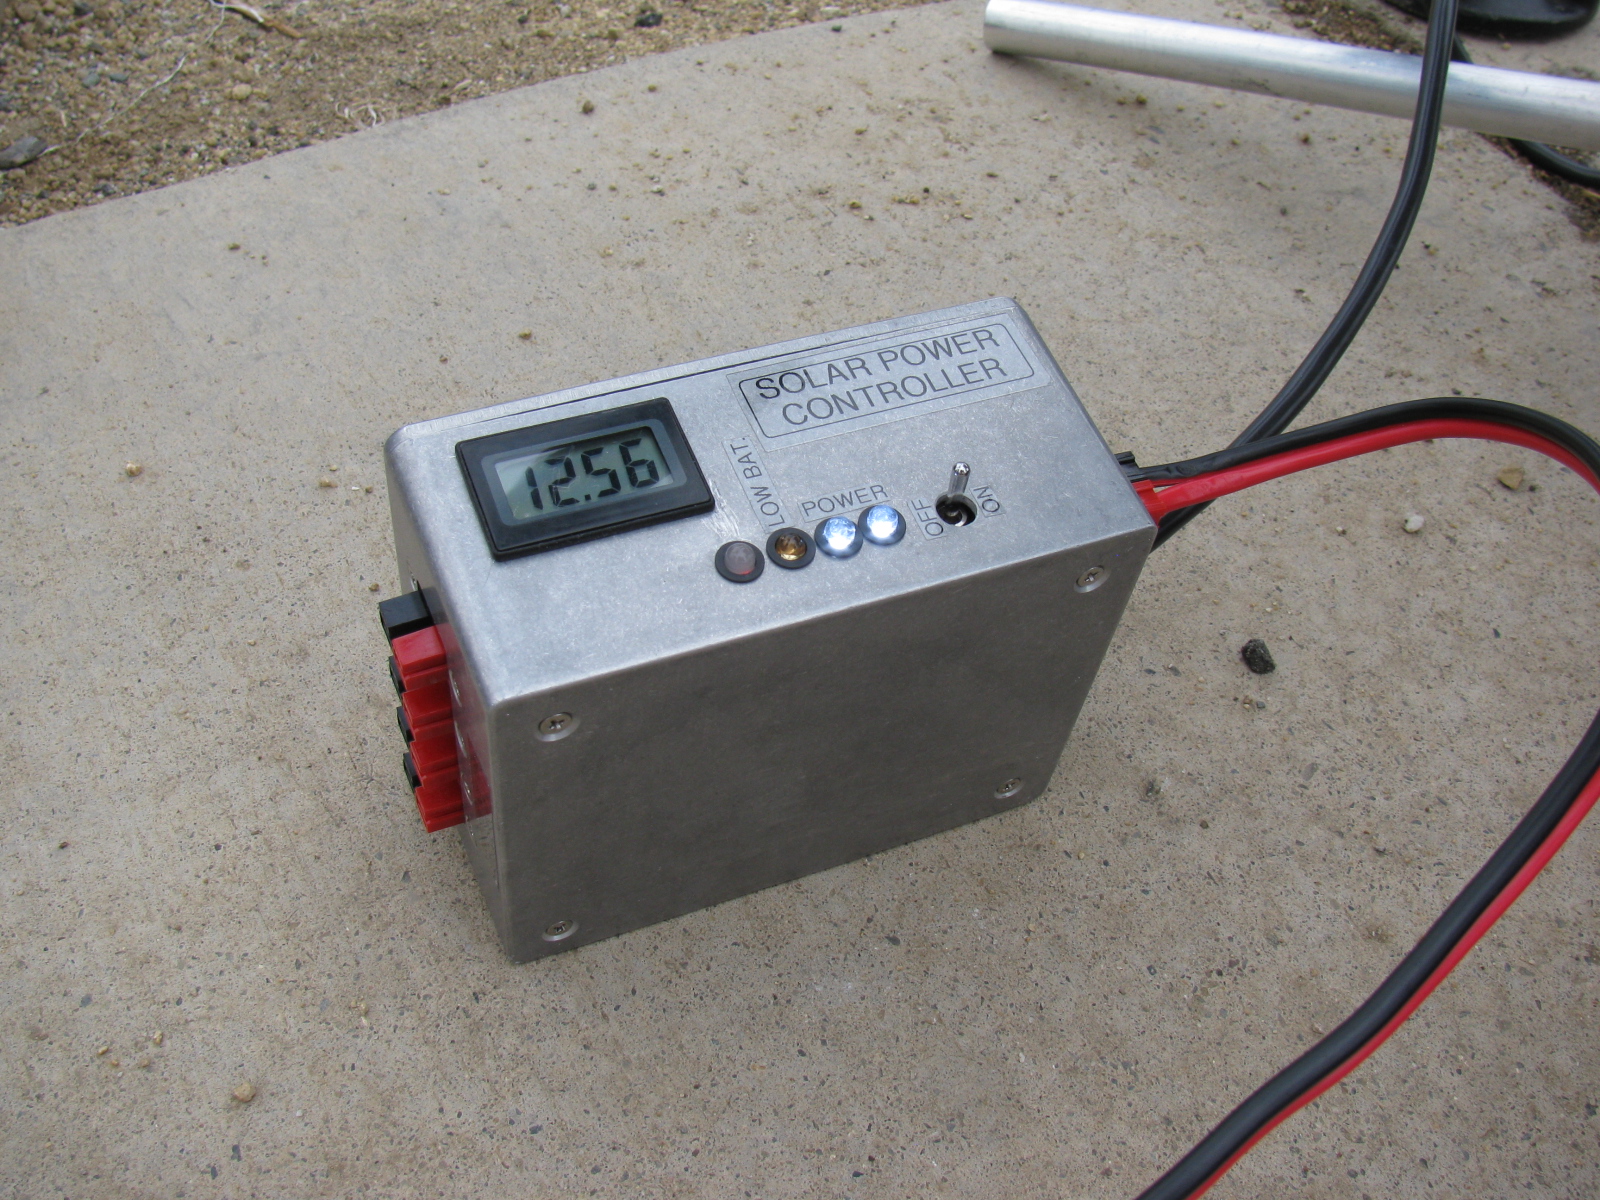
The converter consists of a Frequency West Brick as a 10,223 MHz local oscillator for a mixer used as an upconverter for MDS and down converter for ERP. The converter has a 13 dB horn antenna connected to the mixer RF port. Power is supplied by a 12V battery on the ground with a DC/DC converter supplying the required voltage for the local oscillator. The coax used is 300 feet of RG-59 which was readily available. No attempt to correct matching losses for the 75 ohm coax has been made. The loss of the coax and mixer as well as the amplifier gain was measured at the operating frequencies. It is not really necessary if only relative measurements are to be performed but it does allow a good comparison between measured and calculated values.
The results of the test are entered into a spreadsheet, which then calculates the ERP based on dish size in inches and estimated PA output of the radio under test. The distance in feet from the radios to the converter is input to the sheet, which then calculates the path loss in dB. For ERP, the sheet provides calculated ERP, measured ERP and the difference between them. For MDS at this time, only the signal generator level is recorded and is used for relative measurements.
Block diagrams for the 10 GHz and 24 GHz units are described in the PDFs below:
24 GHz ERP – MDS Block Diagram
Intro to the MDS/ERP Event Results
(From an entry on the SBMS website on August 10, 2012)
These spreadsheets show the results of workshops/picnics where amateur microwave stations were compared on a unique test range for both transmitting and receiving performance. The test setup was developed by Kerry Banke, N6IZW and has been used by the San Diego Microwave Group (SDMG) and the San Bernardino Microwave Society (SBMS) over the past few years. The test setup consists of a remote TX/RX transmitter/sensor unit installed on a pole about 15 ft. high at a distance of approximately 220 ft. from the stations being tested.
The remote transmitter produces a stable signal on the operating frequency, such as 10368 MHz. Operators tune this in with their rigs and peak their antennas. The signal is then reduced in level until barely discernible (MDS). That level is logged. The operator then transmits with maximum CW power and the RX sensor power level is logged. The spreadsheet is used with the logged data and with data on each rigs claimed antenna size and transmit power to allow comparison of measured versus expected performance.
The results have been useful, not from an absolute basis, but by allowing operators to compare their rig’s results against other amateur’s rigs having similar TX, RX, and antenna characteristics. Any major performance differences between systems can help focus on problems that can be solved before upcoming contest events.
In past events, operators have discovered problems with relays, cables, connectors and even non-functioning power supplies.
Interpreting Results
Receive (MDS) performance is shown in the column marked “MDS Gen dBm.” You want the largest negative value compared to other stations having the same size or performance antenna on that frequency band.
In the last column marked “Meas-Calc,” transmit ERP performance is shown. A zero means that the ERP came out exactly as expected given the claimed transmitter power and antenna gain. A positive number indicates an ERP that is better than expected by that many dB. A negative number indicates system performance measures worse than expected.
Here are some results over the past years – 2013 results added!


